
1. Objective
This document provides walkthroughs and suggestions for debugging common issues in a production Lightbits cluster. It follows a symptom-based approach, starting with the observed issue (e.g., loss of service) and progressing through diagnostic steps to identify the root cause.
⚠️ Critical Note: Recovery steps mentioned in this document should always be tried in a non-production environment first if possible. Information in the documentation may differ from your specific version. Proceed with caution when running commands on a live cluster.
2. Major Lightbits Services
Service Name | Description | Log Access |
node-manager | Lightbits node services manager (volumes, snapshots) | /var/log/node-manager.log journalctl -u node.manager |
gftl | Lightbits backend service | journalctl -u gftl |
duroslight-0/1 | Lightbits frontend service | journalctl -u duroslight-0 journalctl -u duroslight-1 |
cluster-manager | Lightbits cluster operations | /var/log/cluster-manager.log |
upgrade-manager | Lightbits upgrade operations | /var/log/upgrade-manager.log journalctl -u upgrade-manager |
api-service | Lightbits RestAPI and command-line operations | /var/log/api-service.log journalctl -u api-service |
lightbox-exporter | Lightbits statistics engine | /var/log/lightbox-exporter.log journalctl -u lightbox-exporter |
profile-generator | Optimize the server resource allocation to Lightbits services. | /var/log/profile-generator.log journalctl -u profile-generator |
discovery-service | Handle client connections | /var/log/discovery-client.log journalctl -u discovery-service.service |
etcd | Lightbits internal database | journalctl -u etcd |
2.1. Checking Lightbits Service Status
To check the service status, execute the following command:
systemctl status <service_name>
Example
systemctl status node-manager.service
● node-manager.service - Node-Manager Service
Loaded: loaded (/usr/lib/systemd/system/node-manager.service; enabled; vendor preset: disabled)
Active: active (running) since Thu 2021-11-04 12:03:11 UTC; 2 weeks 5 days ago
Main PID: 12827 (node-manager)
Memory: 59.3M
CGroup: /system.slice/node-manager.service
└─12827 /usr/bin/node-manager serve
3. System Health Checklist
3.1. Checking Server Status
$ lbcli list servers
NAME UUID State RiskOfServiceLoss State LightOSVersion |
All server states are ‘enabled’.
‘RiskOfServiceLoss State’ = ’NoRiskOfServiceLoss’
3.2. Checking Node Status
$ lbcli list nodes
Name UUID State NVMe endpoint Failure domains Local rebuild progress |
All nodes are in ‘Active’ state.
No rebuild is running.
3.3. Checking Volume Status
$ lbcli list volumes
Name UUID State Protection State NSID Size Replicas Compression ACL Rebuild Progress |
All volumes are in state=”Available”.
All volumes are in “Protection State”=”FullyProtected”.
4. General Debugging & Information Gathering
4.1. Collecting Lightbits Cluster Logs
To expedite the troubleshooting process and ensure quick assistance from the Lightbits team, please open a support ticket via the Lightbits Support Portal and upload the relevant logs to our file server at https://ftp.lightbitslabs.com/ (using the credentials provided by Lightbits).
You can collect logs from all cluster nodes by running the following command on any single node:
lbcli fetch logs --path=LogsFolder --servers-list=all
Where LogsFolder is a path to a local folder where you want to collect logs from all servers
4.2. Control Disk Usage on the Disk Used by Lightbits Servers
The ETCD database used by Lightbits is highly sensitive to disk latency and heartbeat timeouts. Therefore, Lightbits strongly recommends minimizing extra I/O on the drives where ETCD is located. Avoid running additional custom services or executing commands (such as ‘cp’) that generate significant disk activity.
4.3. lbcli Command Returns an Error
Symptoms: when running the command:
lbcli <command> (e.g: lbcli get cluster)
It returns output, like the following:
rpc error: code = Unauthenticated desc = no valid authentication header: Request unauthenticated with bearer
It is caused by a missing JWT configuration.
To resolve the issue, one of the following methods should be applied:
Method #1:
Copy the lightos_jwt file from the Ansible server (by default, the file will be stored in the /root/ folder on the Lightbits servers).
Run the command source lightos_jwt. This will set the JWT string to an environment variable called “LIGHTOS_JWT”.
Run lbcli commands by adding “-J $LIGHTOS_JWT” to the command parameters.
Method #2:
Copy the JWT string from the lightos_jwt file on the Ansible server (the string after “export LIGHTOS_JWT=”).
Add the following line to the /etc/lbcli/lbcli.yaml file:
jwt: <The JWT string copied in #1 above>
Save the modified file.
Now you can use the lbcli without the “-J” flag.
Method #3:
Copy the JWT string from the lightos_jwt file on the Ansible server (the part after “export LIGHTOS_JWT=”).
You can use the lbcli with the “-J” flag, followed by the string copied from item #1 above.
4.4. JWT Expiration
Symptoms
When executing an lbcli command (e.g., lbcli get cluster), the system returns an authentication error:
Example Output:
rpc error: code = Unauthenticated desc = invalid JWT bearer token: token is expired by 7h47m48s
Root Cause
This error indicates that the current JSON Web Token (JWT) has passed its expiration date and is no longer valid for authentication.
Action Plan
The steps required depend on whether you still possess the cluster-admin private key.
Scenario A: Private Key is Available
If you still have the cert-lb-admin-key.pem file (typically located in the lightos-certificates directory), simply generate a new token:
lbcli create jwt --role="system:cluster-admin" --key=cert-lb-admin-key.pem --key-id="system:root" --expiry=2024-12-31T23:59:59Z
Scenario B: Private Key is Lost (Recovery Required)
Please contact Lightbits Customer Success for further assistance.
4.5. Locating the Active Cluster Manager (CM)
For control plane issues (e.g., node inactive, volume stuck in ReadOnly), you must investigate the Active Cluster Manager logs, as only one CM is active at a time.
To find the active CM:
Run the following command on any node to check the logs:
grep "completed election" /var/log/cluster-manager.log
{"level":"info","ts":"2026-04-29T21:13:03.479Z","caller":"candidate.go:231","msg":"******** completed election with: a5682088-cbd8-4fe4-a15f-d026f818c6fa(server02)(hostname: rack08-server72-vm02) (/elections/ClusterManager/1ab79dd51e8e8636) ********** ","server_id":"b15a4430-4925-4efe-b0c4-b4190457c4c7","server_name":"server00","election_name":"/elections/ClusterManager"}
Alternatively, query ETCD directly:
etcdctl get /registry/services/ClusterManager
/registry/services/ClusterManager
{"typeMeta":{"kind":"lightbits.api.ServiceInfo","apiVersion":"v1"},"UUID":"a5682088-cbd8-4fe4-a15f-d026f818c6fa","serverName":"server02","serviceType":"ClusterManager","hostname":"rack08-server72-vm02","serverUUID":"74776ef3-d508-5b90-8fc0-a7a73bb6df2a"}
5. Loss of Service at Client Side
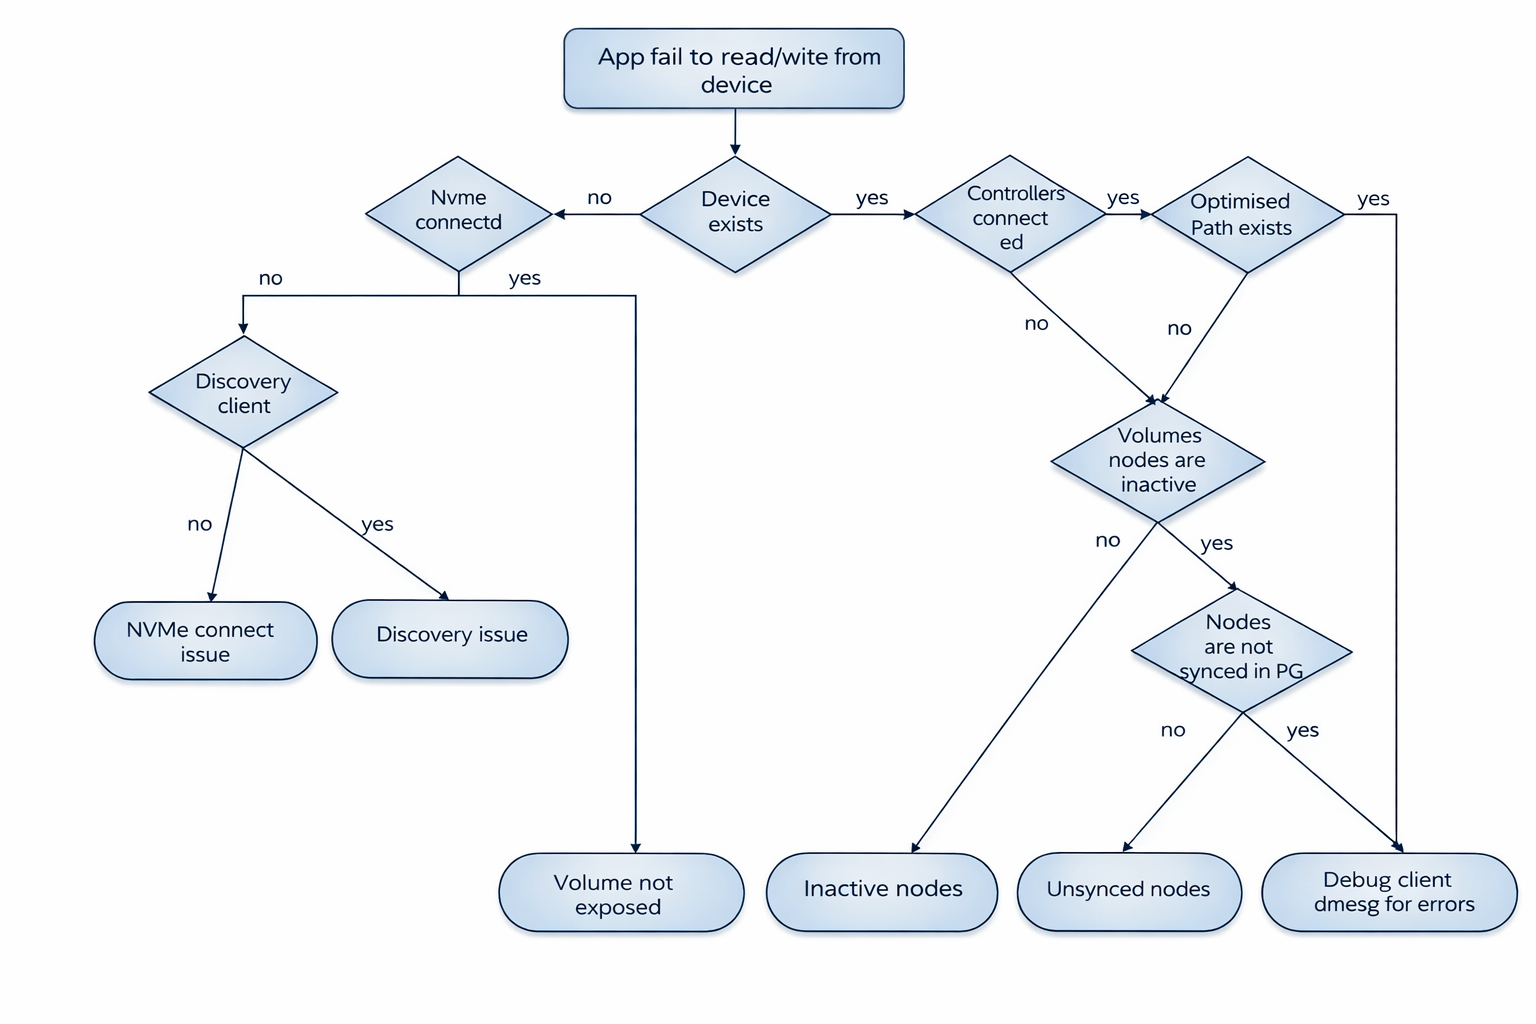
If an application fails to read/write, follow these steps to isolate the failure domain.
5.1. Step 1: Client-Side Device Check
Verify the NVMe device is visible on the client host.
lsblk
nvme list
If device is missing: Suspect a discovery issue. Check the discovery client logs or dmesg for NVMe-TCP connection errors.
If device is present: Proceed to Step 5.2.
5.2. Step 2: Verify Multipath & ANA State
Check if the client has an "optimized" path to the volume./
grep "" /sys/class/nvme/nvme*/nvme*c*n1/ana_state
/sys/class/nvme/nvme12/nvme12c12n1/ana_state:optimized
/sys/class/nvme/nvme13/nvme12c13n1/ana_state:inaccessible
Expected Output: At least one path should show optimized.
If all are inaccessible: Check the volume protection state on the cluster side.
If optimized exists: The storage path is healthy; investigate application configuration.
5.3. Step 3: Check Controller Connection State
Ensure the NVMe controllers are connected and live.
grep "" /sys/class/nvme/nvme*/state
Expected Output: live.
If connecting: The client cannot reach the storage node. Proceed to check Node Status (Section 6).
5.4. Step 4: Verify Volume Exposure
If the network and nodes are healthy, but the volume is not accessible:
Check the Volume Access Control List (ACL). Ensure the volume is allowed for the client's Host NQN.
Check duroslight logs on the storage nodes for errors during volume creation/attachment.
6. Node Status Issues
6.1. Node is "Inactive"
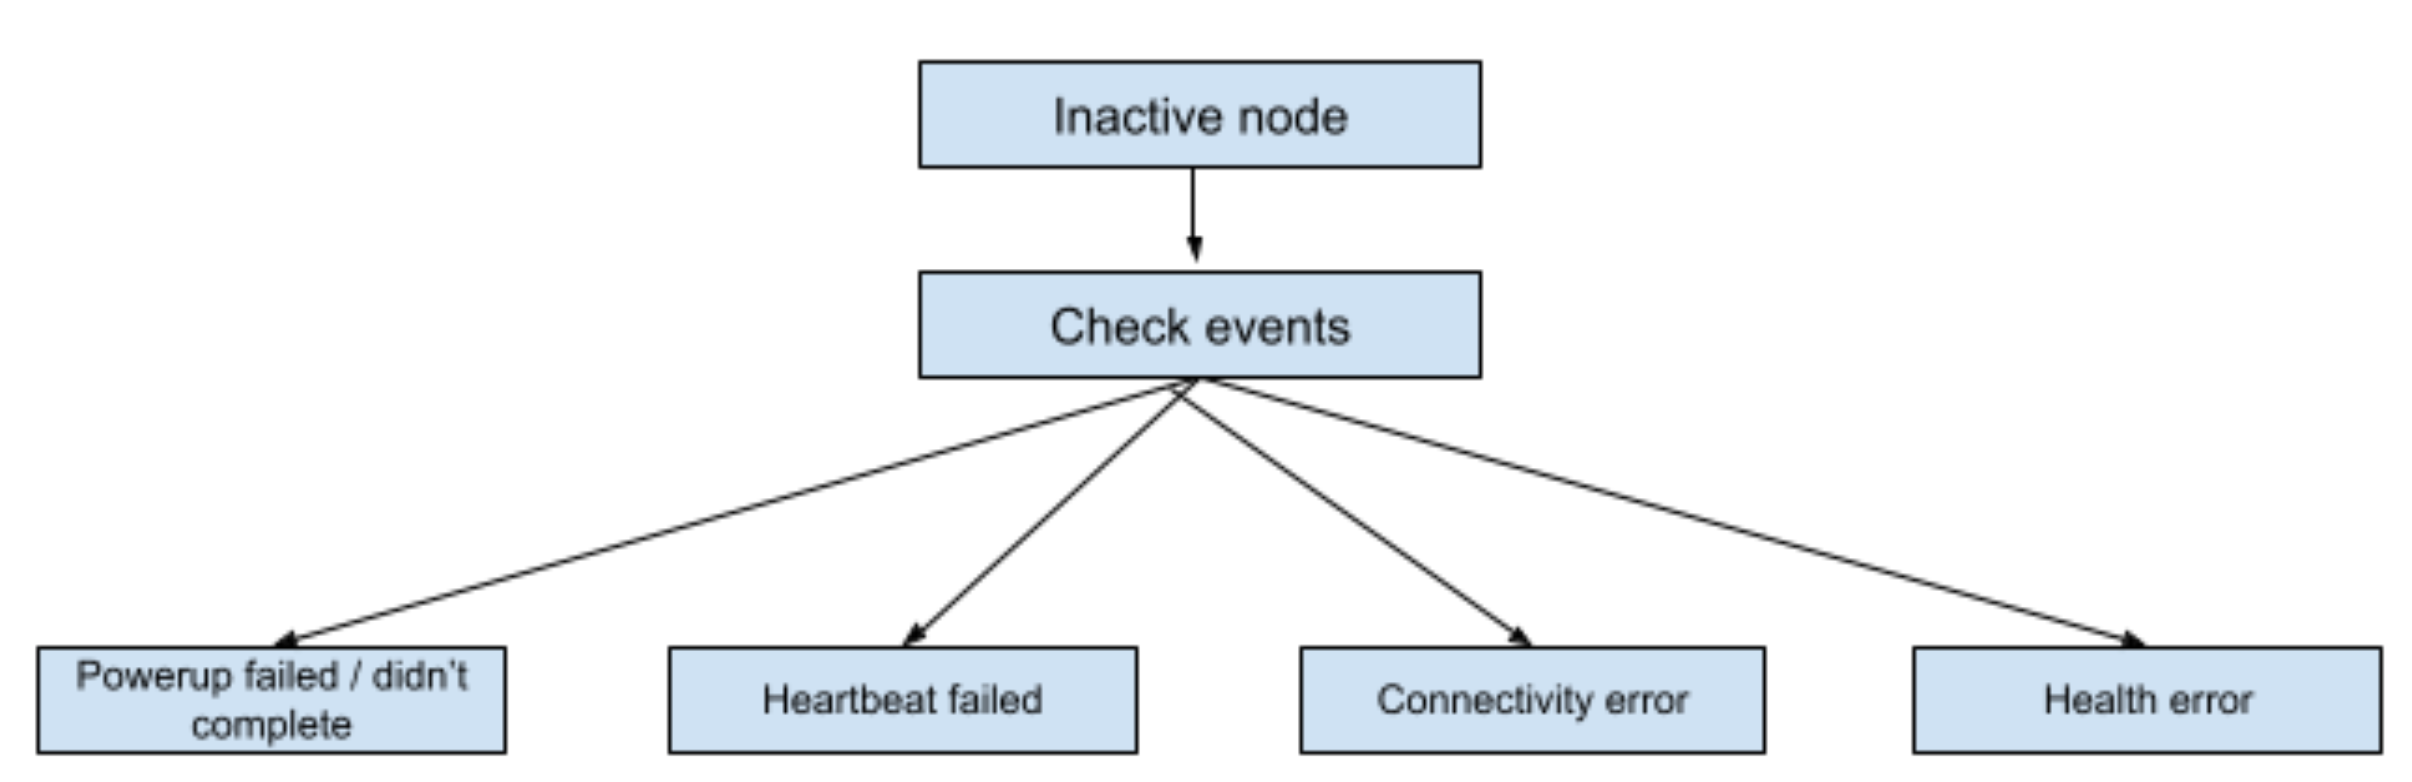
An Inactive state usually indicates the control plane cannot communicate with the node or a critical service has failed.
Diagnostic Steps:
Check Events:
lbcli list events --component-type=node
Common Causes based on Events:
No Heartbeat: Suggests the node is down or the node-manager service is hung. Check service status (systemctl status node-manager).
Powerup Failure: Check node-manager.log for startup errors.
Disk Errors: Run lbcli list nvme-devices to check for failed drives.
6.2. Node is "ReadOnly"
A ReadOnly state is typically not a bug; it is a safety mechanism usually triggered by overutilization.
Diagnostic Steps:
Confirm State:
lbcli list nodes -o json | grep -i readOnly
Check Capacity: Verify if the node is full.
Check Rebalancing: Ensure dynamic rebalancing is not disabled in feature flags.
Check Hardware: Look for multiple disk failures reducing available capacity.
7. Volume Issues
7.1. Identifying Volume Replicas & Primary Node
To troubleshoot volume issues, identify which nodes host the volume's replicas and which node is the Primary.
Using the API (Recommended):
lbcli get volume --uuid=<VOLUME_UUID> -o json
Look for the nodeList to see assigned nodes.
Look for primaryNodeUUID to identify the leader.
Using ETCD (If API is unavailable):
Find the Protection Group (PG) UUID for the volume:
etcdctl get /registry/cluster/volumes/<VOLUME_UUID>
Get the PG details to see the peer list and roles:
etcdctl get /registry/cluster/pgs/<PG_UUID>
7.2. Volume is Unavailable / Degraded / ReadOnly
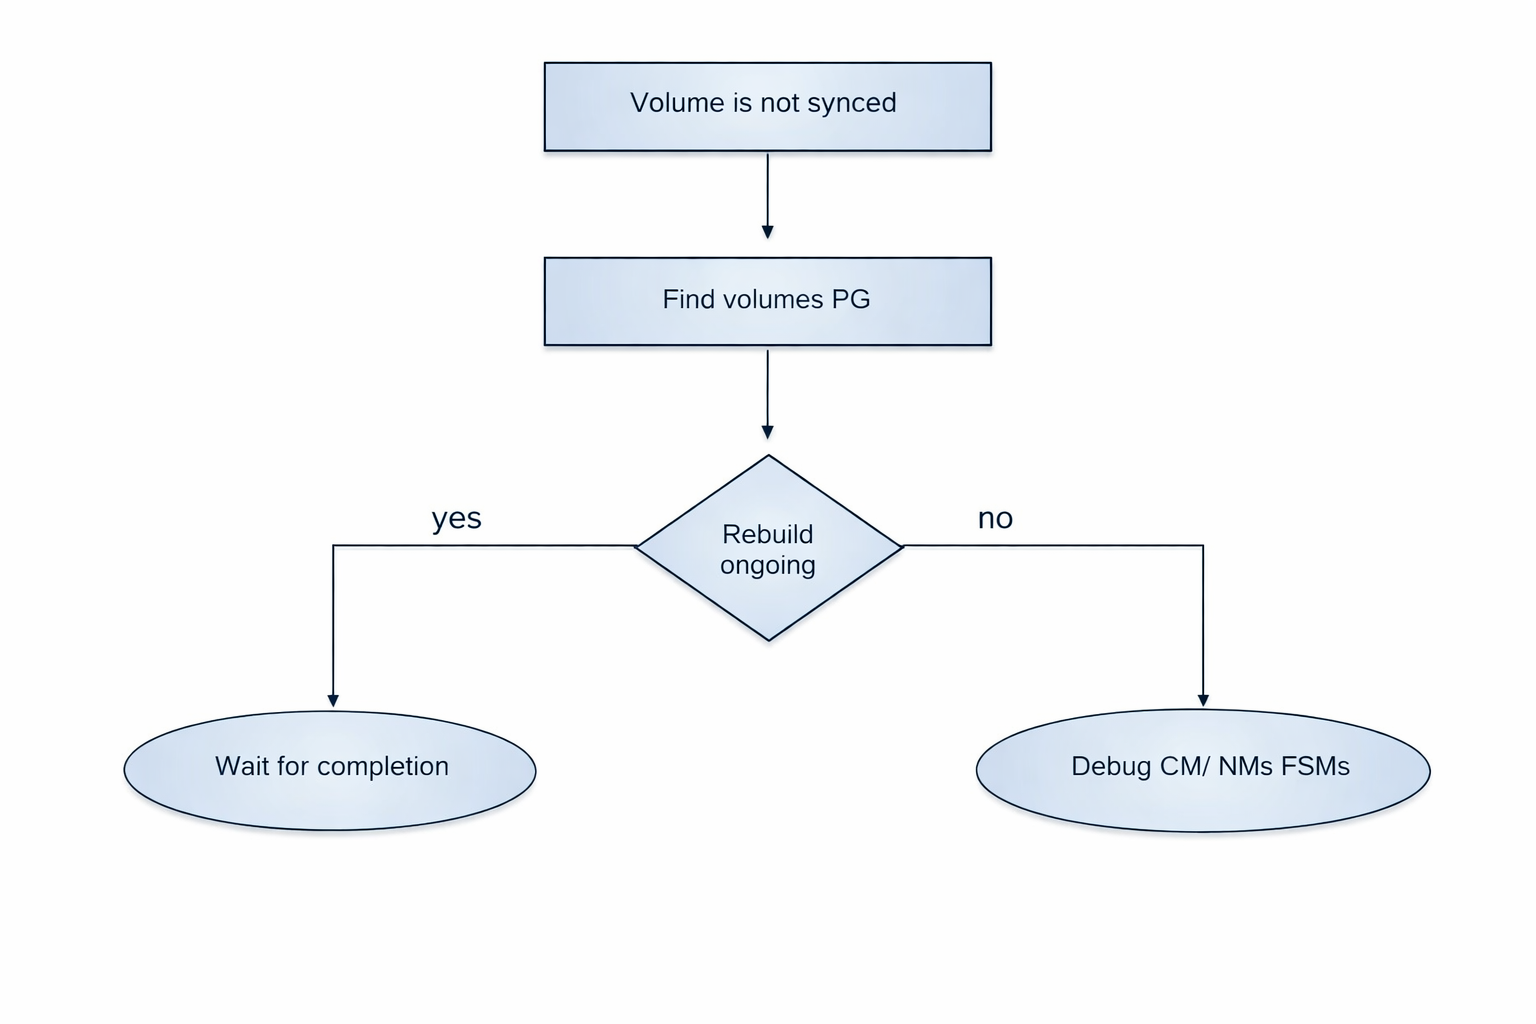
If a volume is not FullyProtected, the replicas may be out of sync.
Check Rebuild Progress:
Determine if the system is actively repairing the volume.
lbcli list volumes --uuid=<UUID> -o json | grep -i rebuildProgress
Identify the Lagging Replica:
Compare the cluster-level version of the protection group against the node-level version.Cluster Key: etcdctl get /registry/cluster/pgs/<PG_UUID>
Node Key: etcdctl get --prefix /registry/nodes/pgs/<PG_UUID>/
Analysis: If a node's protectionGroupVersion is lower than the cluster's, that replica is not synced.
7.3. Volume Creation Failed
This is typically a placement issue (e.g., not enough healthy nodes to satisfy the replication factor).
Action: Search the Active CM (Cluster Manager) logs for the Volume UUID or placement errors:
grep "failed to find matching protection group" /var/log/cluster-manager.log
7.4. Volume Delete Stuck
A volume deletion will not complete until the volume is removed from all nodes.
Check for Inactive Nodes: If a node containing a replica is Inactive, the deletion cannot finalize until the node returns or the system triggers a forceful migration (if applicable).
Check ETCD Keys:
etcdctl get --prefix /registry/volumes/<UUID>/nodes
Any remaining keys indicate nodes that have not yet acknowledged the deletion.
7.5. Snapshot Delete Stuck
A snapshot cannot be deleted if it has descendants (clones or other snapshots created from it).
Action: Check Cluster Manager logs for dependency errors:
grep "can't be deleted since there're still existing descendants" /var/log/cluster-manager.log