This article details how to configure SMTP alerts for a Lightbits cluster, using Prometheus/Grafana and Alertmanager.
Prerequisites
The following prerequisites are required for configuring the alerts:
- A Lightbits cluster
- The Grafana and Prometheus Lightbits monitoring solution installed on a Docker host.
# docker psCONTAINER ID IMAGE COMMAND CREATED STATUS PORTS NAMES3c5f32700553 grafana/grafana:9.3.6 "/run.sh" 7 months ago Up 5 months 0.0.0.0:3000->3000/tcp, :::3000->3000/tcp lightbits-grafanab48950a5b5e4 prom/prometheus:v2.42.0 "/bin/prometheus --w…" 7 months ago Up 5 months 0.0.0.0:9090->9090/tcp, :::9090->9090/tcp lightbits-prometheusAlerts will be set up through Prometheus and Alertmanager. Alertmanager is a separate process that will be installed via Docker. Prometheus will process the metrics and alerts that it polls from Lightbits, and send the alerts to Alertmanager. Alertmanager then forwards the alerts to an SMTP server, which sends out email notifications.
Installation
Installation requires first installing Alertmanager and then configuring Prometheus.
Installing Alertmanager
If you are in a dark site, start with the dark site preparation steps below. If you are not in a dark site, skip to the normal steps.
Preparation for a Dark Site
xxxxxxxxxx# On an x86_64 server with Docker, run these two commands to save alertmanager to file:docker pull quay.io/prometheus/alertmanagerdocker save quay.io/prometheus/alertmanager > alertmanager.tar# Share the tarball and md5sum.# You can then download and confirm md5sum and load alertmanager.md5sum alertmanager.tar# d4a77de6548ed2a0e10375ef36c50075 alertmanager.tar# From your monitoring server:docker load < alertmanager.tar# Now continue with the normal steps below.Normal Steps
From the monitoring server, run the steps below.
xxxxxxxxxxmkdir /etc/alertmanager/Create the configuration file. This configuration file uses the Lightbits SMTP server. You will need to modify it.
xxxxxxxxxxcat > /etc/alertmanager/alertmanager.yml << 'EOF'global # The smarthost and SMTP sender used for mail notifications. smtp_smarthostsmtp.SERVER.com587 smtp_from'FROM@EMAIL.com' smtp_auth_username'FROM@EMAIL.com' smtp_auth_password'XXXXXXXXXXXXXXXXXXXXXXXXXXXXXXXXXXXXXXXXXXXXX' smtp_auth_identity'FROM@EMAIL.com' smtp_require_tlstrue# The directory from which notification templates are read.templates'/etc/alertmanager/template/*.tmpl'# The root route on which each incoming alert enters.route # The labels by which incoming alerts are grouped together. For example, # multiple alerts coming in for cluster=A and alertname=LatencyHigh would # be batched into a single group. group_by'alertname' 'cluster' 'service' # When a new group of alerts is created by an incoming alert, wait at # least 'group_wait' to send the initial notification. # This way ensures that you get multiple alerts for the same group that start # firing shortly after another are batched together on the first # notification. group_wait30s # When the first notification was sent, wait 'group_interval' to send a batch # of new alerts that started firing for that group. group_interval5m # If an alert has successfully been sent, wait 'repeat_interval' to # resend them. repeat_interval3h # A default receiver receiverteam-mainreceiversname'team-main' email_configsto'TO@EMAIL1.com'EOFModify the following sections above.
- Global SMTP section. This determines to which SMTP server the alerts are sent to directly from the monitoring server, and from which email address they will be sent to the final receiver.
- Configure the receiver's address at the bottom. In this case the alerts are sent to “team-main”, which can be a single email address or a list of email addresses. For this example, the alerts are only sent to a single email address; however, a list of emails can be provided instead using yaml array notation.
Start Alertmanager. In a dark site, this command will use the loaded image provided earlier. In a normal site, it will download Alertmanager from the internet.
docker run --restart=unless-stopped --name alertmanager -d -p 9093:9093 -v /etc/alertmanager/alertmanager.yml:/etc/alertmanager/alertmanager.yml quay.io/prometheus/alertmanagerConfirm that this started by checking its logs:
xxxxxxxxxxdocker logs alertmanagerExample output:
ts=2024-03-28T22:21:23.232Z caller=main.go:181 level=info msg="Starting Alertmanager" version="(version=0.27.0, branch=HEAD, revision=0aa3c2aad14cff039931923ab16b26b7481783b5)"ts=2024-03-28T22:21:23.232Z caller=main.go:182 level=info build_context="(go=go1.21.7, platform=linux/amd64, user=root@22cd11f671e9, date=20240228-11:51:20, tags=netgo)"ts=2024-03-28T22:21:23.233Z caller=cluster.go:186 level=info component=cluster msg="setting advertise address explicitly" addr=172.17.0.4 port=9094ts=2024-03-28T22:21:23.234Z caller=cluster.go:683 level=info component=cluster msg="Waiting for gossip to settle..." interval=2sts=2024-03-28T22:21:23.252Z caller=coordinator.go:113 level=info component=configuration msg="Loading configuration file" file=/etc/alertmanager/alertmanager.ymlts=2024-03-28T22:21:23.252Z caller=coordinator.go:126 level=info component=configuration msg="Completed loading of configuration file" file=/etc/alertmanager/alertmanager.ymlts=2024-03-28T22:21:23.254Z caller=tls_config.go:313 level=info msg="Listening on" address=[::]:9093ts=2024-03-28T22:21:23.254Z caller=tls_config.go:316 level=info msg="TLS is disabled." http2=false address=[::]:9093ts=2024-03-28T22:21:25.234Z caller=cluster.go:708 level=info component=cluster msg="gossip not settled" polls=0 before=0 now=1 elapsed=2.000545688sts=2024-03-28T22:21:33.237Z caller=cluster.go:700 level=info component=cluster msg="gossip settled; proceeding" elapsed=10.003044918sYou should now have three containers running:
# docker psCONTAINER ID IMAGE COMMAND CREATED STATUS PORTS NAMES4aba9160b219 quay.io/prometheus/alertmanager "/bin/alertmanager -…" 5 seconds ago Up 3 seconds 127.0.0.1:9093->9093/tcp alertmanager3c5f32700553 grafana/grafana:9.3.6 "/run.sh" 7 months ago Up 5 months 0.0.0.0:3000->3000/tcp, :::3000->3000/tcp lightbits-grafanab48950a5b5e4 prom/prometheus:v2.42.0 "/bin/prometheus --w…" 7 months ago Up 5 months 0.0.0.0:9090->9090/tcp, :::9090->9090/tcp lightbits-prometheusYou can access the Alertmanager dashboard from its endpoint over port 9093. This link will take you directly to the status page, which shows the configuration. http://IP:9093/#/status
Configuring Prometheus
Next, configure Prometheus to point to Alertmanager. By default, it will have a configuration already; you will just need to edit the endpoint and api_version.
Edit the prometheus.yml configuration file.
xxxxxxxxxxvim /var/lib/monitoring-clustering/prometheus/prometheus.ymlLocate the section at the bottom, which looks like this:
xxxxxxxxxxalerting: alertmanagers: - api_version: v1 enable_http2: True follow_redirects: True scheme: http timeout: 10s static_configs: - targets: - "alertmanager:9093"Edit the api_version to v2 and the target to the IP of the Docker host running alertmanager:
xxxxxxxxxxalerting: alertmanagers: - api_version: v2 enable_http2: True follow_redirects: True scheme: http timeout: 10s static_configs: - targets: - "10.32.0.15:9093"bReload Prometheus with its new configuration (this will not restart anything):
xxxxxxxxxxdocker exec -it lightbits-prometheus kill -1 1Note that you can also more evasively restart Prometheus this way:
xxxxxxxxxxdocker restart lightbits-prometheusTesting the Alert
Assuming a proper configuration, alerts might already be coming in. However, the system can be manually tested.
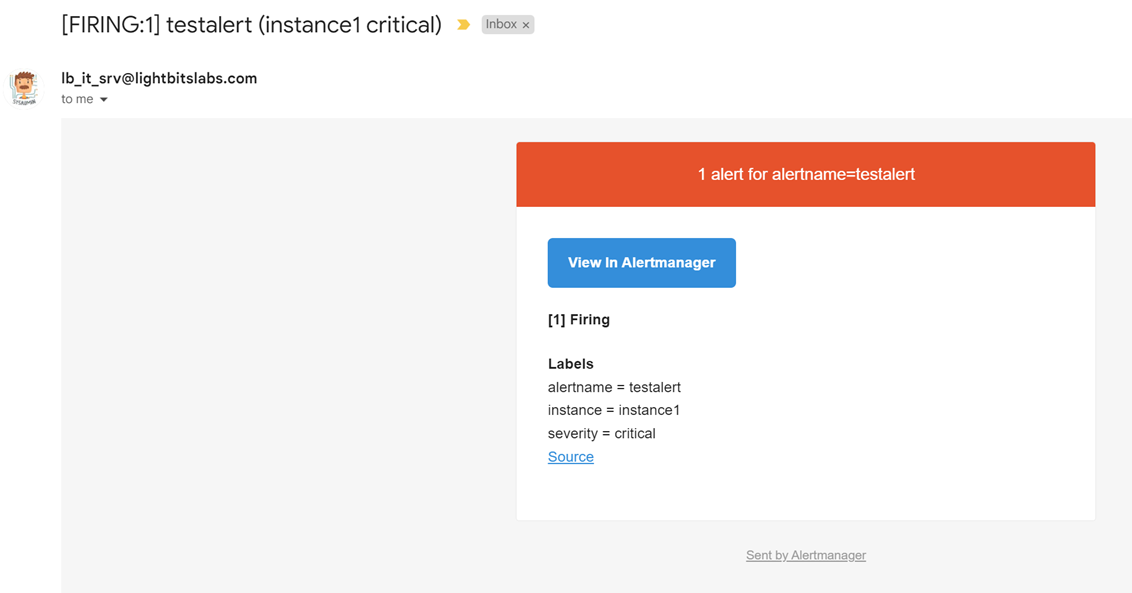
Send a test alert (this sends an alert with the name-testalert from instance1 with severity=critical):
docker exec -it alertmanager amtool alert add alertname=testalert instance=instance1 severity=critical --alertmanager.url 'http://localhost:9093'The alert should appear in your alert list now. It only lists alerts that need to be silenced:
xxxxxxxxxxdocker exec -it alertmanager amtool alert query --alertmanager.url 'http://localhost:9093'# Output:Alertname Starts At Summary Statetestalert 2024-03-29 06:25:14 UTC activeThe alert should appear in your email inbox within 30 seconds or so:
Silence the alert from the UI, or with amtool. Note that a comment is required.
docker exec -it alertmanager amtool silence add alertname=testalert --comment "Silencing test alert" --alertmanager.url 'http://localhost:9093'The output will show the unique ID of the silenced alert. Also, the output of the query command should no longer show the testalert.