Using Grafana
Log in to Grafana.
From the welcome dashboard, click Dashboards and then Browse.
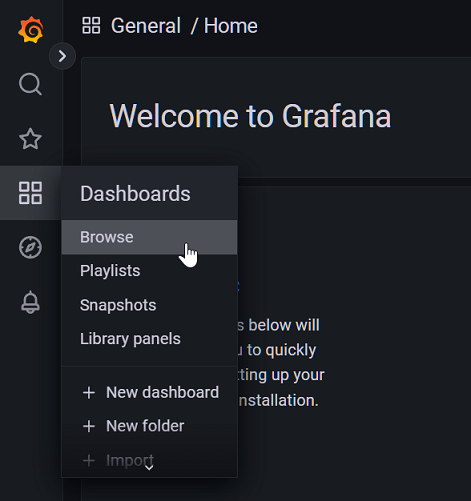
The following dashboards will be visible:
cluster_tab: stats and monitoring for the full cluster.
nodes_tab: stats and monitoring for each node.
Lightbits Server Performance Tab: server performance stats and monitoring.
Lightbits Volumes Performance Tab: volume performance stats and monitoring.
Etcd by Prometheus: etcd stats and monitoring.
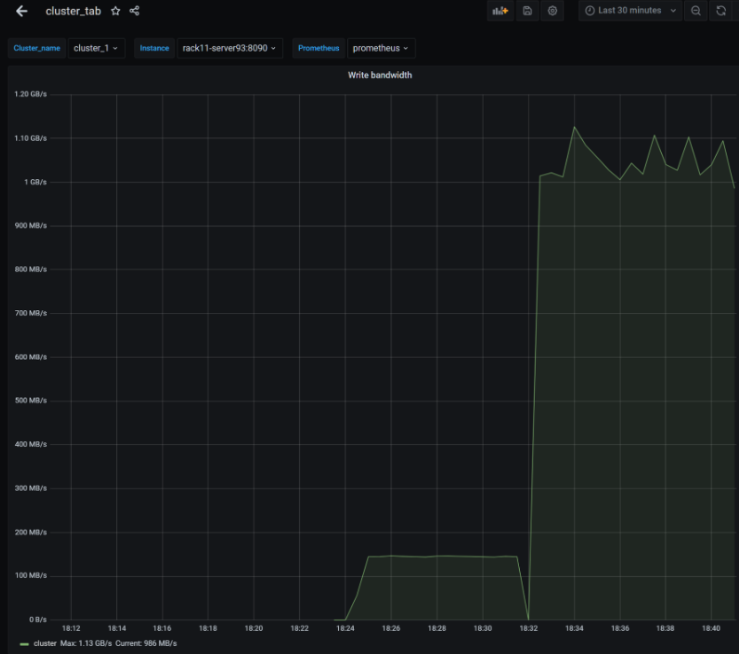
Below is a screenshot of the cluster_tab dashboard. This is composed of multiple sections of graphs, statistics, and tables.
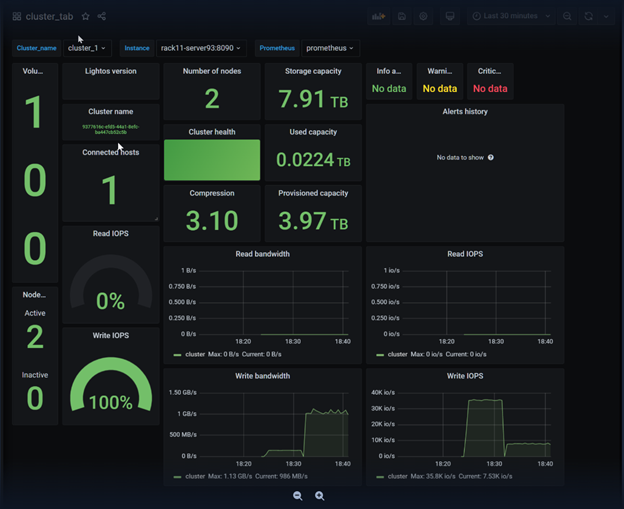
Hovering over each section reveals an arrow with additional options.
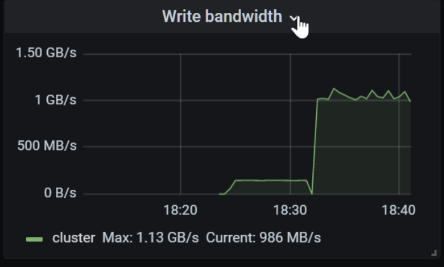
Click on each artifact's arrow button. Clicking the View option will expand the window to full screen.
Using Prometheus
Prometheus can be used to query any of the time series metrics received from a Lightbits cluster. The metrics come in at the cluster level and node level. This means that most metrics can be viewed for each node and also for the cluster as a whole. Prometheus is also helpful in figuring out the full names of metrics, which then can be used for creating dashboards in Grafana.
As an example, let's look at the write bandwidth for the whole cluster. The values will be shown in their raw format. We can assume that this will be in “bytes/seconds”; however, if this is not the case, we could compare with other known values.
Step 1
After logging into Prometheus, ensure that Use Local Time and Enable Autocomplete are enabled. Local time will help in lining up the times to your time zone, regardless of the server’s time zone. Autocomplete will help explore all of the different metrics.

Step 2
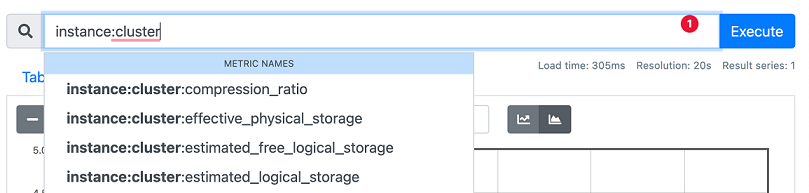
Start by writing “instance:cluster” into the expression field. As characters are entered, it will show available metrics in the drop-down. As more characters are entered, the drop-down menu converges on specific metrics.

With Enable Autocomplete, as text is typed into the expression field, Prometheus will then show metrics that have matching text as a drop-down.
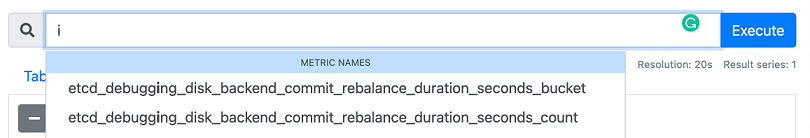
As you enter more text, you will see less metrics that are more specific.
Scroll to the bottom of the drop-down metric names:
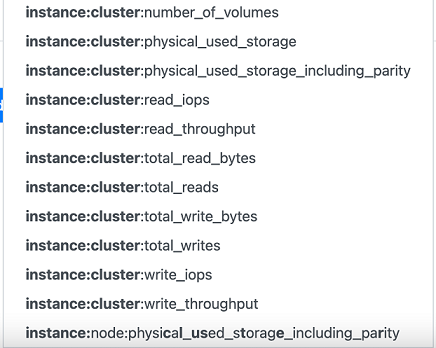
Here we can see that we have “write_iops” and “write_throughput” as options. Since we want to know about write bandwidth, the suitable metric would be “instance:cluster:write_throughput”.
Tip
One good way to know what to type into the Expression field is to study the drop-down. Another is to simply view all of the available metrics.
To view all possible Prometheus metrics, curl, wget or open your browser to http://localhost:9090/api/v1/label/name/values.
The output will be large, but it will have all of the metrics. Here are example snippets of the output (searching for the word “throughput”):
Step 3
Finish typing “instance:cluster:write_throughput” into the Expression field, or select it from the drop-down menu, and enter Execute.
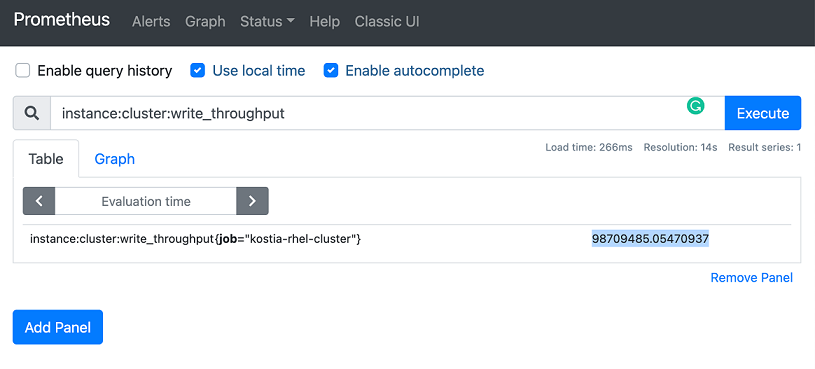
Here we can see the raw value of the cluster write_throughput expressed in bytes. We can see that the current write throughput is 98709485 bytes per second. This matches the fio job running in the background.
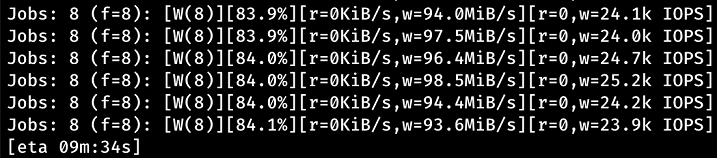
The following is the fio command that was launched from the same client.
The fio output also shows 93 MiB/s:
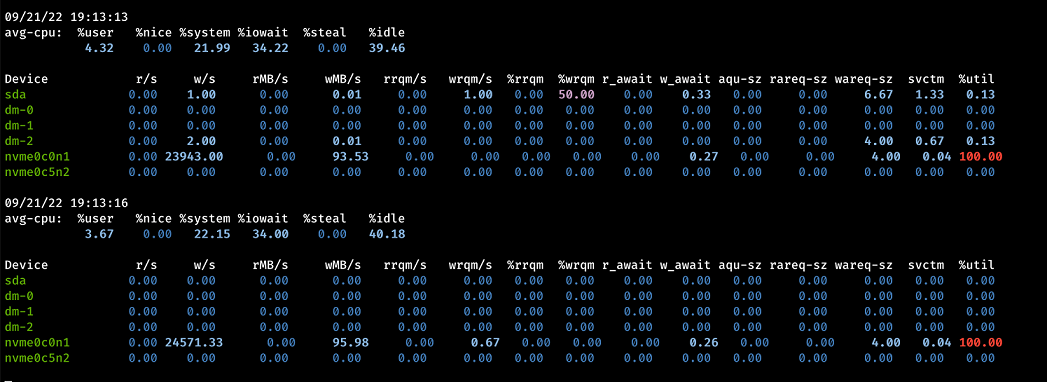
The following is the output of iostat -tmx 3, also showing 93 MiB/s:
Step 4
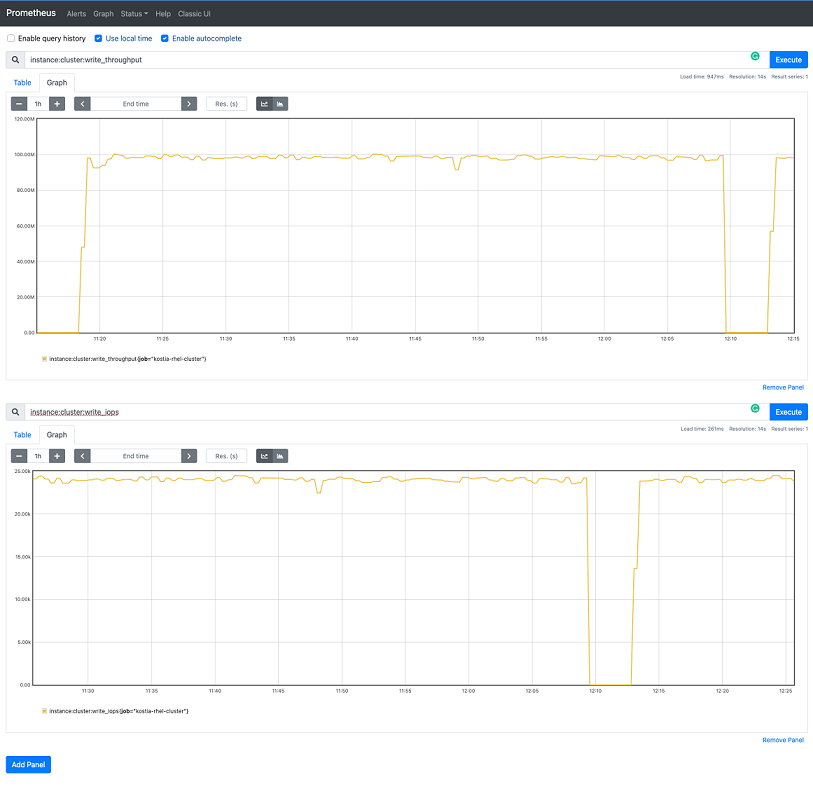
Click Graph to view the graph output. The duration of the graph and end time and shading of the graphs are adjustable with the buttons.
Here the graph shows the last 1 hour’s worth of data. However, any time period can be viewed by adjusting the values in the boxes.
Note that there was a period of no throughput when the the fio job was cancelled temporarily.

Step 5
In Prometheus, you can also:
Create alerts (this can also be done in Grafana).
Stack other metrics to compare. Click Add Panel and then follow the same steps above to add another expression. As an example, in the screenshot below, another panel was added to the bottom showing the write IOPs metric of the entire cluster, by using the expression ”instance:cluster:write_iops”.