
Prometheus gathers statistics from the Lightbits cluster. Grafana in turn represents everything in graphs on dashboards. This monitoring package can monitor several clusters at once, and multiple clusters can be configured.
The following details how to provision a monitoring stack with Prometheus and Grafana. The instructions below are relevant for Lightbits versions 3.4.1 and above.
Ensure that SELinux firewall permissions are permissive before deploying.
Prerequisites
Designate a non-Lightbits server for the Lightbits monitoring solution to be installed. Ensure that the following software is installed on the designated monitoring host.
Hardware specifications:
10 cores
32 GB RAM
128 GB of storage
Connectivity to Lightbits' access network (Lightbits exporter service and API service).
Installing Monitoring Packages
To install the monitoring packages, run the following:
For Deb-packaged based OSs (for example, Ubuntu), see Connecting to the Cluster Client DEB Repository, and then run: sudo apt-get install lightos-monitoring-images lightos-monitoring-clustering.
Monitoring Stack Deployment
To start running the Prometheus and Grafana containers, run the following (clustering):
Configuring Prometheus
Prometheus should be configured with all of the jobs to scrape, and alert and recording rules. The only remaining step in configuring Prometheus is adding all the targets for the Lightbits cluster.
Since this information is deployment-specific, each one should follow the provided example and set the host accordingly.
Each Prometheus instance can monitor multiple clusters at the same time.
To add a cluster to monitor or to update an existing cluster, run the commands in the section below.
Adding Prometheus Targets
The following example illustrates how to generate the configuration for a cluster named cluster_1, which has three servers:
rack01-server01
rack01-server02
rack01-server03
You will then need to configure Prometheus to scrape the services that run on all of the nodes.
The following command generates targets.yaml files that define Prometheus endpoints to scrape. See the <file_sd_config> section of the Prometheus Documentation for additional information.
This action creates the following files:
Ensure that the yaml configuration files have the minimum permissions, and reset the files permissions in the Prometheus container to be rw-r--r-- and not rw-------.
Since we bind-mounted the /var/lib/monitoring-clustering/file_sd_configs folder to the Prometheus container, this command issues a reload to Prometheus that is configured to collect these endpoints.
Verify that the targets were configured correctly by viewing http://<prometheus_host>:9090/targets.
--high-precision and --dual-instance Flags
The command also includes two optional flags: --high-precision and --dual-instance.
When set, --high-precision writes a per-cluster target file under file_sd_configs/high-precision/, pointing at port 9190, alongside the existing api-service (443) and lightbox-exporter (8090) targets. A static high-precision scrape job (5s interval / 4s timeout) is added to prometheus.yml, reading /targets/high-precision/*.yaml. The job is a no-op when no high-precision clusters are registered.
When --dual-instance is combined with --high-precision, each server produces two high-precision targets, on ports 9190 and 9191, instead of a single 9190 target. The --dual-instance flag is independent of --high-precision, and can be reused for other target types in the future. Currently, it only takes effect within the high-precision target set.
Example:
You will need to select the high precision dashboard in Grafana to view.
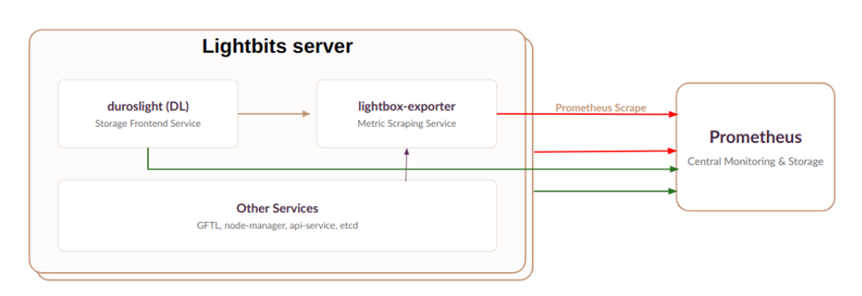
In the figure below:
Legacy metrics are scraped at a low rate via lightbox-exporter (port 8090). These are not affected by this design: the scrape path and contents are unchanged.
High precision metrics are scraped directly from each front-end instance (ports 9190 and 9191 in dual-instance configurations).
Prometheus configurations with a set of new scrape targets (one per node) effectively enable the HF metrics.
A new dedicated HF volume performance Grafana dashboard that presents data in real time, and with ~1s resolution.
Installation/upgrade paths enable ports 9190/9191 in firewall/iptables.
No other actions are required to enable HF metrics - via API or otherwise.
Removing Prometheus Targets
The following command will undo the former command:
This will delete the following files:
/var/lib/monitoring-clustering/file_sd_configs/api-service/cluster1-targets.yaml
/var/lib/monitoring-clustering/file_sd_configs/lightbox-exporter/cluster1-targets.yaml
And issue a reload to Prometheus.
You can verify that the configuration works by:
Navigating to
http://<prometheus_host>:9090/config- making sure that the expected configuration is used.Navigating to
http://<prometheus_host>:9090/targets?search=- making sure that the targets configured in the previous step are updated.
remove_cluster also cleans up the high-precision target file, and deploy pre-creates the directory so that Prometheus watches a real path.
Configuring Grafana
Grafana should be configured automatically with the deployed Prometheus instance as a data source and all the dashboards that Lightbits provides to monitor the cluster.
Cleaning Up Deployed Containers
To run the deployment again or clean the machine from artifacts that this operation applied, run the following command:
Uninstalling Monitoring Packages
To uninstall monitoring packages, run the following command:
For Deb-packaged based OSs (for example, Ubuntu), run: sudo apt-get remove lightos-monitoring-images lightos-monitoring-clustering
Enabling Persistent Journal log
To aid with troubleshooting and support, Lightbits recommends setting the journal to keep logs even after reboots and shutdowns. To ensure that the OS disk does not fill up, Lightbits also recommends updating the log rotation.
Enable persistent journaling:
Enable log rotation: